Image
view of peri-urban Medellin

How will our cities grow in the future? A new approach

According to the latest predictions from the United Nations, the world’s population will continue to grow in the coming decades - but it won’t be the same level across the globe. The population growth within and the migration flux toward urban centres will certainly modify the size and shape of what our cities look like.

But predicting just how exactly that will happen is challenging: our cities are complex, non-linear, spatio-temporal dynamic systems, with many input variables and internal states interacting all at the same time. Sometimes we can’t even measure or collect basic data for modeling, and when we can, the data is very noisy. Political and administrative decisions influence the spatial urban growth of cities, but in many developing countries, for example, the law and development plans do not always represent the same reality. This creates a dual problem for modeling urban growth, as one has to choose a blend of predicting what “will be” - purely based on “human intuition” and “available historical data”.

So how can we try to map out future urban footprints then?

Despite these difficulties, there are a few models out there that attempt to capture this growth under different assumptions using an array of analytic and numerical tools. In a recent paper, my colleagues and I at EAFIT University in Medellín introduced a new approach: a data-driven urban-growth framework that uses machine learning to predict the distribution of three important variables: population distribution; binary urban footprint; and visual appearance in colour.

Here’s how it works:

Urban Growth Framework


Figure 1 illustrates a general overview of our framework. The main idea behind it is to use the historical record of a few spatially-distributed variables to infer the population distribution, and then use it to classify spatial regions into urban and non-urban categories based on the per-pixel urbanisation rate, and finally, estimate what the urban areas would look like if they were captured by a satellite camera. In short: we’re using the past to predict the future. In our paper, we tested the framework in two Colombian cities,  Valledupar and Rionegro, which we chose due to their strong differences in terms of topographies, spatial growth patterns (compact vs. sprawl), and population composition.

With this urban-growth framework, we can also predict future scenarios considering different input variables. The most common scenario assumes the status quo: that the input variables will continue as they have so far. Simple, right? But we think that it is more interesting to assess just how much the outcomes will change when one of the input variables is modified to mimic a policy, plan, or proposal, while all the other variables are left as they are. This process is known as sensitivity analysis.

Here’s what we found in the city of Valledupar, where we performed a sensitivity analysis based on the maximum-population-capacity input, or the most amount of people physically allowed on a certain plot of land, or neighbourhood. You can imagine this variable as a digital image where each pixel corresponds to a spatial region and its value represents the maximum number of people per unit area allowed by a local government. Why did we choose this variable? Because we couldn’t find it anywhere in the official master plan for the city, and we wanted to assess its importance in shaping the city’s spatial evolution.


graph showing results of different growth scenarios

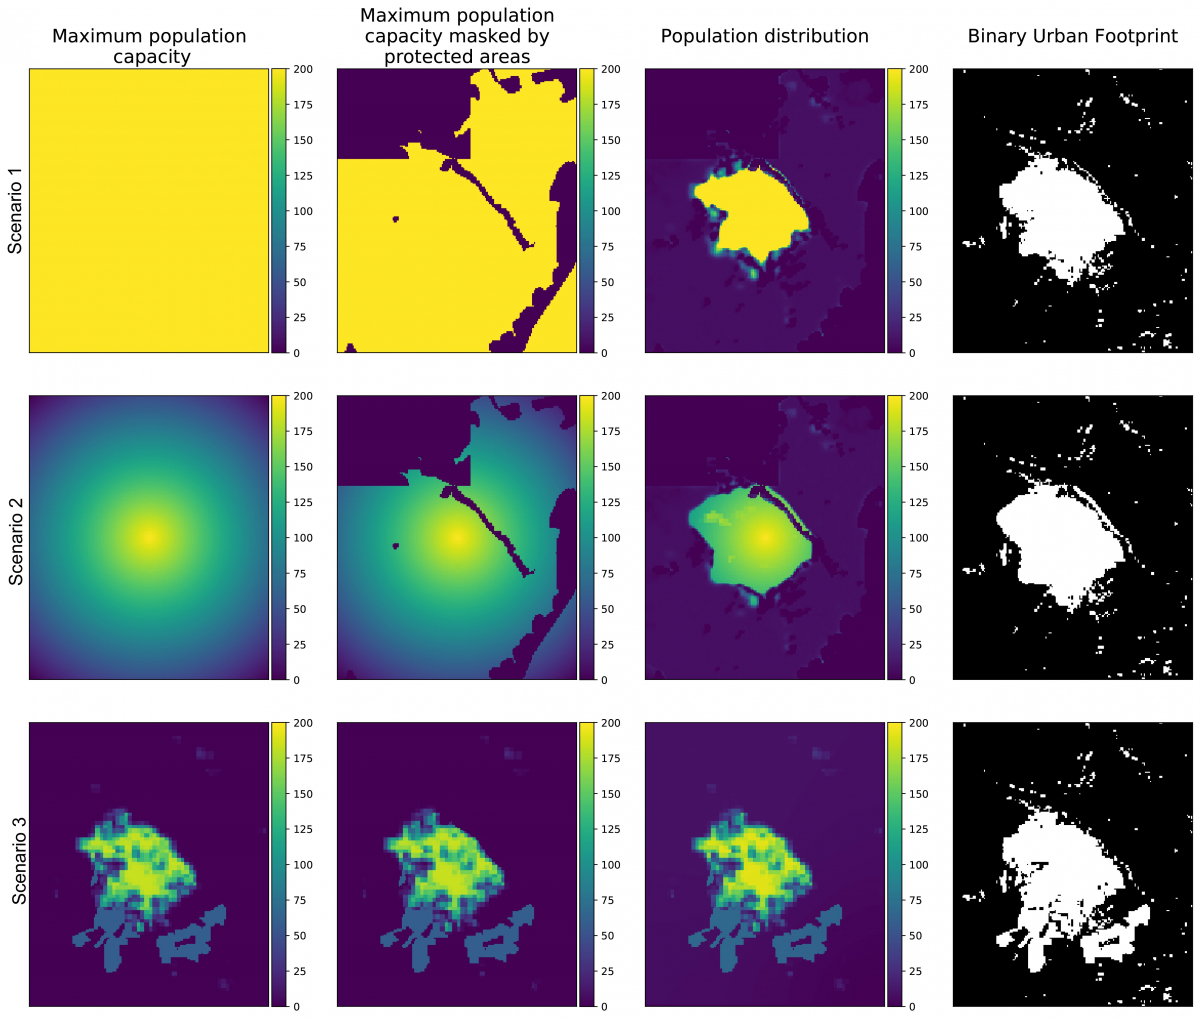
Figure 2. Sensitivity analyses of predicted urban growth for the city of Valledupar (Colombia) in 2050, given three different policies for the maximum population capacity, which are shown across the different rows. The first column illustrates the hypothetical maximum population capacity maps without taking into account any of the protected areas. The second column shows hypothetical maximum population capacity maps taking into account the protected areas. The third column shows the population distribution (number of people in each square region of 100 m x 100 m). The fourth column shows the binary urban footprint, where white represents urban areas and black represents non-urban areas. Thanks to Mr. Santiago Passos for compiling this chart for this blog.

We ran three different hypothetical scenarios for our sensitivity analysis using a regular grid with a pixel size of 100 meters by 100 meters until the year 2050. The results are summarized above in Figure 2.

For the first scenario, we used a constant maximum population capacity map of 200 people/pixel, and we find that such policy promotes densification. In the second scenario, we reduced this maximum population capacity radially outwards from the city center using the same initial value as before, and we find that this new policy promotes a fairly symmetric expansion of urban footprint. For the third scenario, we set the maximum capacity close to values of the population distribution in 2015, but introduced the planned expansions areas of the city with a small capacity of 60 people/pixel. What happened then?

This last policy triggers a quick urbanization process, changing completely the city’s original compact shape. According to the simulations, the total urban areas for the three scenarios would oscillate among 44, 47, and 56km2 respectively by 2050, while the average values of the urban population density (i.e. total urban population divided by the total urban area) will oscillate among 13162, 12530, and 9599 people/km2, respectively, for each scenario.

From these results, what is abundantly clear is that the shape of the future urban growth in Valledupar — and perhaps cities of all shapes and sizes — is profoundly influenced by the specific selection of the maximum population capacity. How much sprawl or density is allowed to the greatest possible extent in future plans will dramatically affect how those spaces fill out, or up.

We think that by using analyses like ours, local planning departments can assess the potential impact of some of the administrative decisions that are being made on the size and shape of a city over time. This could provide valuable feedback during the policymaking process, and ease coordination with the required stakeholders. Each “possible urban future” can have a different effect on the city and its inhabitants, as well as on its economy and environment. So, it is always important to assess and add known variables — like the master plan, protected areas, and planned infrastructures — to the sensitivity analysis to get the full picture.

Once we better understand these key variables, it will be easier to adapt the policies to achieve more controlled and sustainable urban growth.