
Income mobility and inequality in Colombian cities: who is working hardest to close the gap?
Rising income inequality and its associated lack of upward mobility is a global challenge. The lack of social mobility in emerging economies in particular was highlighted in a 2018 OECD report. This is something that our team at EAFIT is currently exploring for Colombia. Even though inequality and social mobility are often seen as nation-wide phenomena that require national-level policies, based on our work on cities, we posit that understanding those problems requires a local perspective.
What is the best way to measure social mobility?
Although we all have an idea of what social mobility means, its measurement is harder than one might think. For instance, should we focus on education, occupation or income? Should it be assessed from one generation to other (e.g. comparing parents´ and children´s education) or in the same generation, analyzing individuals´ lifetime productivity? Moreover, should we focus on relative mobility (e.g. an individual´s rank position compared with another’s rank position) or absolute mobility (e.g. society improvement regardless who benefits from the new scenario)?
In our research we use social security administrative data known as as PILA (Planilla Integrada de Liquidación de Aportes in Spanish) collected by the Health and Social Security Ministry. The PILA dataset has longitudinal information between 2008 and 2018 (i.e. it follows the same people over this period) and can be interpreted as a “census” of the formally employed population in Colombia. This dataset provides a unique opportunity for assessing income mobility in the formal employment sector in Colombian metropolitan areas. Based on this data set, we are able to focus on intra-generational mobility, that is, personal income mobility over the life course.
We define mobility as equalization of long term-incomes for the same individuals. In order to measure equalization of incomes, we rely on the E index proposed by Fields (2010). This index has three features:
1. It is negative if the richest person gets richer, holding other incomes constant.
2. It is positive if the richest person gets poorer, holding other incomes constant.
3. It equals zero if the richest person’s and everybody else’s incomes are unchanged.
We assessed the E index for the main twenty-three metropolitan areas of Colombia.
What have we found so far?
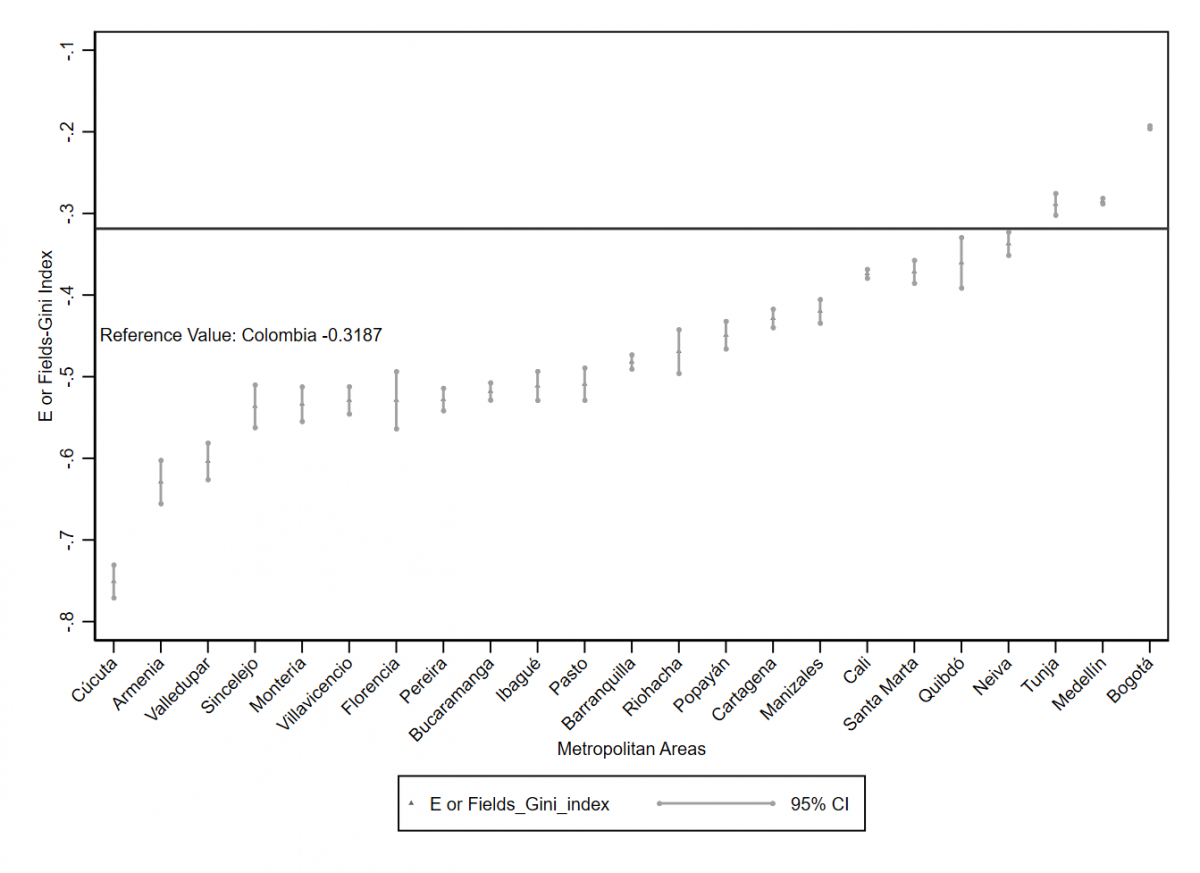
We found for the entire country the E index is negative, which means between 2008 and 2018 the mobility of the population in formal employment became more unequal (horizontal line in Figure 1); we use this calculation for having a reference estimation. We also found that mobility in the twenty-three metropolitan areas became more unequal but with interesting differences. In Figure 1, from left to right, we ranked the metropolitan areas from the worst position to the best position. We found that Bogotá and Medellín rank in the first two positions, respectively, followed by Tunja. However, other important areas in terms of economic and social performance rank in intermediary positions, such as Cali in the seventh position, Barranquilla in the twelfth position and Bucaramanga in the fifteenth position. The worst ranked areas are Cúcuta and Armenia.
We conclude that the leaders of the process of reducing inequality and fostering mobility are Bogotá and Medellín. From a policy perspective, it is important to investigate more closely the factors have contributed to this result so they can be further fostered them and replicated in other areas. Currently we are investigating two possible explanatory factors; the diversity in the industrial sector; and migration. But this will be a discussion for a future blog!