To accommodate urban growth, local governments and stakeholders have to plan and build new infrastructure that provides water, electricity, gas, internet, telecommunication, and road networks, as well as schools, hospitals, and other basic amenities. The infrastructure building in developing countries is a sequential process that rarely anticipates the arrival of new communities. The reasons include lack of coordination, legal barriers, budgetary issues, and the fast-paced establishment of informal settlements.
In Colombia, public utility companies can provide electricity networks quicker than aqueduct and sewage networks, as it is easier to install new poles, wires, and transformers than to dig up the ground and install pipes for connecting new users with existing water supplies. Here, it is important to understand that planning this much-needed infrastructure demands knowledge — both of the spatial distribution of new urban areas, as well as the expected demand of the infrastructure. For instance, the infrastructure required to provide public services to dozens of families is substantially different than the infrastructure required to support industries or commercial establishments, even if they can be spatially distributed across geographic areas of similar sizes.
In our latest project for PEAK Urban, we wanted to figure out a way to model these differences. So we developed an urban growth framework based on machine learning to predict the spatiotemporal urban footprint growth as well as the spatial distribution of the population. After testing it in different geographies, we knew that we could adapt it to tackle urban challenges faced by public utility companies.
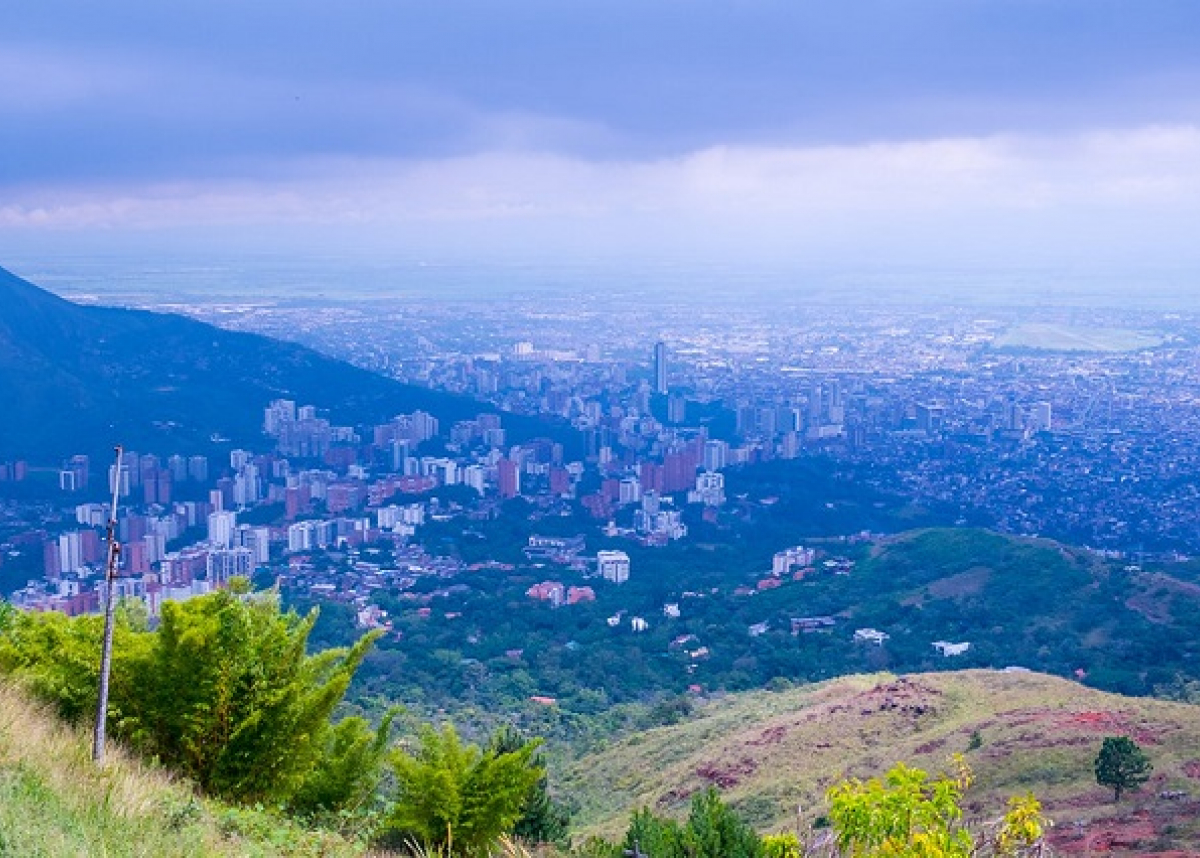
The opportunity to validate our hypothesis arose with one of the largest companies of its kind in Colombia, Medellín’s Public Utility Company (Empresas Públicas de Medellín, or EPM). During the first phase of our collaboration, we collected historical records of the aqueduct, sewage, and electricity connections and consumptions when this data was available, and combined them with official demographics, current master plans, and housing projections. We included other data available worldwide, such as satellite imagery from the Landsat program, population distribution from the GHS program, binary urban footprint, terrain slope from the SRTM mission of NASA, and road networks from Open Street Maps. We used this dataset to estimate the aqueduct and sewage demands, even in territories with very little or no official records. We called the resulting program Newton.
After analyzing various territories in Colombia and their constraints, we clustered them into four cases, and each one of them became a different operation mode for Newton. The four cases were: 1) territories where there are no official records of the aqueduct, sewage, or electricity connections; 2) territories where there are official records of electricity (as electricity tends to get installed first), but no records of the aqueduct or sewage connections; 3) territories where there are official records of electricity, and at least a year of records of the aqueduct and sewage connections; and 4) territories that have a complete historical record of aqueduct and sewage connections.
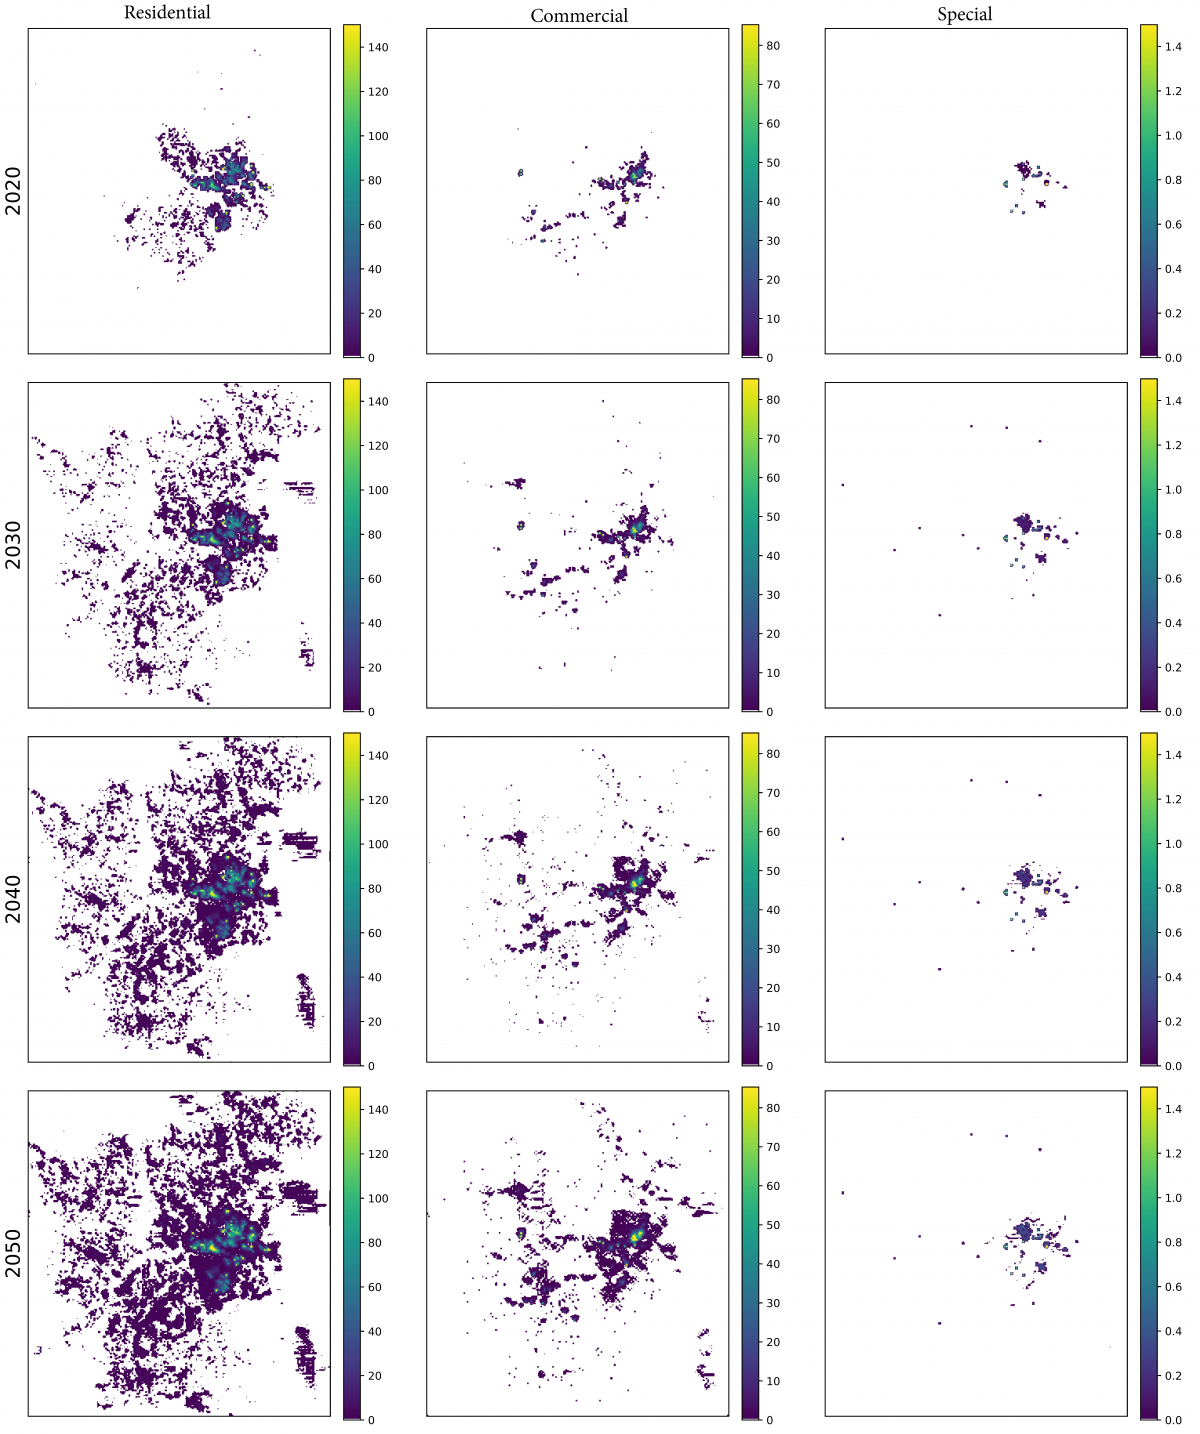
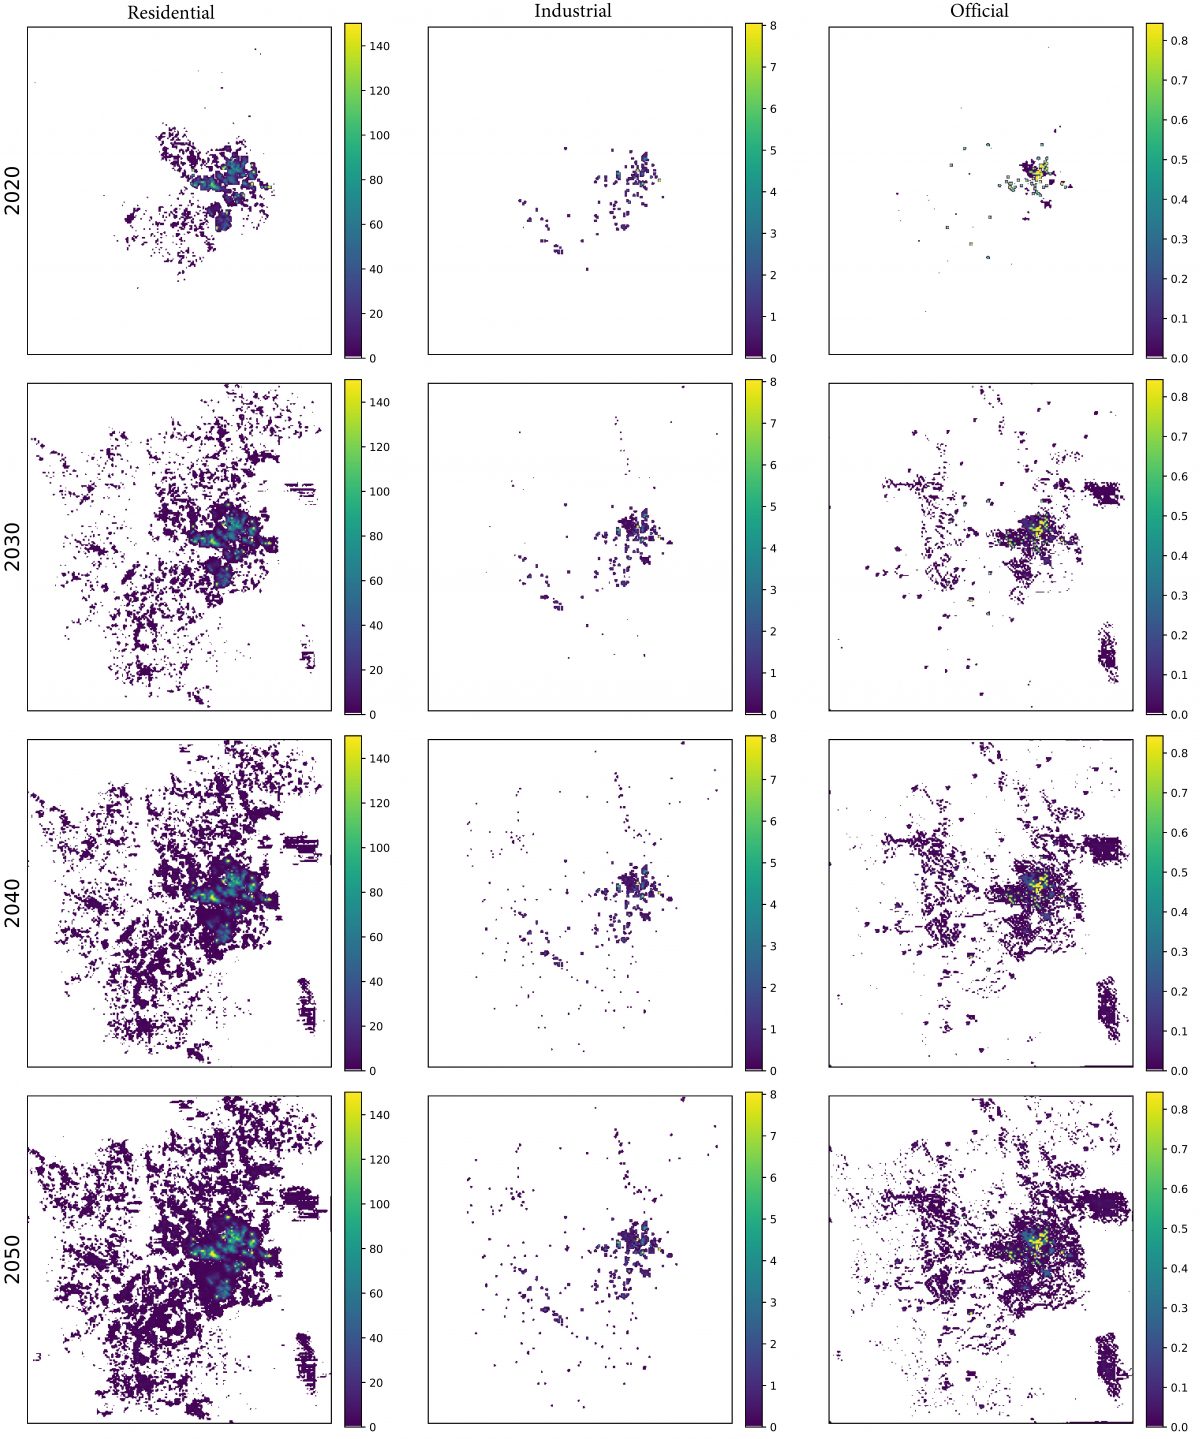
For the first case, Newton predicted urban growth using the freely available data, and then converted the spatial population distribution into the spatial distribution of houses using information from the average number of residents per home taken from the latest census information. In this case, assuming that there is one aqueduct connection per house, we ended up with a spatial distribution of residential aqueduct connections that get transformed into sewage connections using a regression analysis learned from another territory with more data. For the second and third cases, after predicting urban growth, Newton estimated the electricity connections for five different users: commercial, special, industrial, official, or residential connections. In this process, Newton used the same spatiotemporal regression framework that we created to predict urban growth in the first place.
Once the program had the spatiotemporal electricity connections predictions for each user type, it transformed them into aqueduct and sewage predictions using a regression model learned in a territory with combined records of electricity, aqueduct, and sewage connections. The main difference between the second and third cases was that those territories falling into the third case do have at least one historical record, and Newton provided a better estimation. Finally, in the fourth case, after predicting the urban growth, Newton estimated the aqueduct and sewage demands using the historical data and our spatiotemporal regression framework directly, without having to use electricity as an intermediate variable.
After predicting the aqueduct and sewage connections in a given territory, Newton transformed them into consumptions for each public service, using the predicted average consumption rates in cubic meters per year for each user. This estimation process took historical information when it was available and combined it with expert assessments using machine learning algorithms. The resulting maps with the connections and consumptions were then spatially aggregated into circuits and basins and reported yearly.