Accessing huge amounts of open geospatial data from different sources has been a game changer for researchers across the globe working on urban development. One of my favorites is OpenStreetMap , which is free to use everywhere, anywhere. When requiring historic information, I always look for the Landsat archive from the US government, which is a great resource for accessing and downloading the Landsat satellite imagery taken since the 1970s. It would be a great shame if the US government start to charge for the service again.
Recently, I have had the opportunity to meet with different experts on urban remote sensing from around the world, and one thing caught my attention: the majority of the research and analysis done last year in this field is being implemented using open tools (free software that can be customized and complemented), and a great part of that research relies almost exclusively on open data.
For me, this is a welcome change. Only ten years ago, one of the greatest challenges of doing urban research in Colombia was having access to proper geospatial data.
As researchers, open data allows us to develop analysis and visualizations of changes in recent decades at a very low cost. By using aerial photography, satellite imagery and time-lapse visualizations we can have new insights into how the city has grown, and what are the most prevalent trends.
Some could argue that a city must have the budget to buy its data, but that is rarely the case in most of the Global South. This is particularly the case for medium and small cities, whose budgets are very stretched. At least a third of future urban growth will happen in these small and medium size cities in the Global South, yet few will have the resources to access the data or to survey their own territory. The availability of open data and low-cost resources to study urbanization in developing countries are therefore critical.
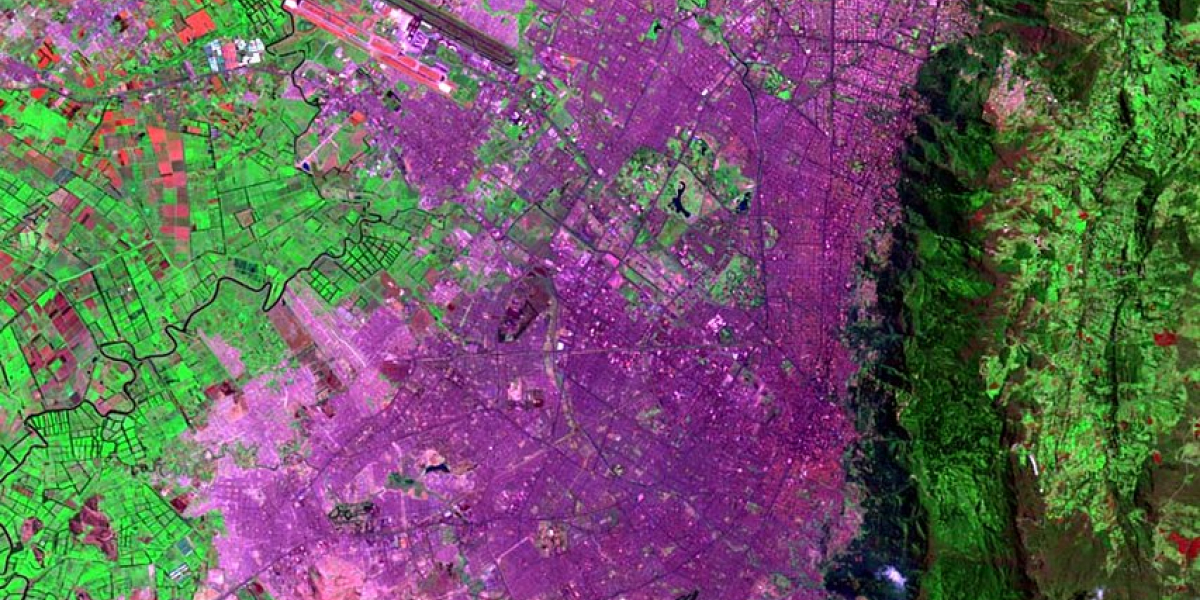
The following geo-visualization is a 34-year time-lapse of Valledupar city, Colombia, which we created using open satellite images from the Landsat archive, and the open source software QGIS and GIMP. These visualization uses a colour composite in which vegetation appears red, and contrasts very well with the cyan-blue of the developed areas. The only valuable resource that we used was our own time!
34-year time-lapse geo-visualization of Valledupar city, Colombia
Tools like this allow the identification of urban growth trends, and to help us check if the city is spatially expanding over protected lands or hazardous areas -too high in the hills, or too close to the river-, and to have a sense of the speed of this spatial growing, something directly related to the provision of public services on the new urban areas.
By identifying those trends, local authorities can revisit their planning practices, or they can select some problematic areas to check in deep with field work. Open data and tools also mean more accountability on the part of the authorities.
Citizens now can benefit themselves as they can use tools like this on their own to better understand how urban growth has happened in their very city, and they can compare that past grow with the plans of the authorities for future growth to analyze their feasibility, or to check if the past promises were fulfilled or not. The Atlas of Urban Expansion, (developed by the NYU Urban Expansion Program at the Marron Institute of Urban Management and the Stern School of Business, in partnership with UN-Habitat and the Lincoln Institute of Land Policy), is a great example of a web-tool that uses the open Landsat archive to get insights into global urban expansion to inform urban planning decision-making. The LandSense project takes these tools even further to connect citizens with satellite imagery, with the aim of engaging citizens in monitoring changes of the urban landscape within their cities.
As part of our work in the PEAK Urban project at RiSE Group in EAFIT University, we are using open satellite imagery to map the urban areas on a yearly basis since the 1980s. We are using this information, along with other open data on different topics like protected areas boundaries, water bodies, and topography, among others, to train a machine learning model that could predict future urban growth trends. The aim is to produce a model that be used as a planning tool, in which we could answer what-if questions related to the development of the city and make informed decisions for better planning. We look forward to sharing the results of this in the coming year.